Setup your own Elastic Stack

Data is great. Data is power. If you're like me, you love data and you also love collecting it. In my life I've written so many crawlers and scrapers, I've used public APIs to collect weather data or track the subscribers of some streamers. I just love it. In todays post I would like to show you how to set up your very own Elasticsearch instance and how to visualize your data using Kibana.
Elasticsearch and Kibana
Both, Elasticsearch and Kibana are products of Elastic. Elasticsearch is a NoSQL database that can be setup and used all by its own. Kibana however was build for managing your Elasticsearch database and to visualize your data. We will deploy the stack on our local machine but you can also follow the same instructions on a server or VM.
Prerequisites
We will deploy the stack using Docker Compose. So first thing we need to do is to check for the required packages. If docker is not yet installed we can use the official installation guide to do so. Then we check the installation with the following commands.
# Check for docker
docker -v

# Check for docker compose
docker compose version
Since we will setup both Elasticsearch and Kibana in seperate docker-compose files we need to create an external docker network such that we can connect both containers to the same network. So we will create one named tutorial.
# Create a docker network
docker network create tutorial
Now we're good to go.
Elasticsearch
First we need to create a new directory where we can save the Elasticsearch docker-compose.yaml file to.
# Create a new directory
mkdir elasticsearch

# Change directory
cd elasticsearch
Next step, we copy the following content to a file named docker-compose.yaml.
version: "3"

volumes:
  config:
  data:

services:
  node:
    image: docker.elastic.co/elasticsearch/elasticsearch:8.11.2
    volumes:
      - config:/usr/share/elasticsearch/config
      - data:/usr/share/elasticsearch/data
    environment:
      - discovery.type=single-node
    ports:
      - 127.0.0.1:9200:9200
    healthcheck:
      test:
        [
          "CMD-SHELL",
      "curl -s --cacert config/certs/ca/ca.crt https://localhost:9200 | grep -q 'missing authentication credentials'",
        ]
      interval: 10s
      timeout: 10s
      retries: 120
    networks:
      - tutorial

networks:
  tutorial:
    external: true
docker-compose.yaml
The configuration should be self-explanatory. However, if we want to dig a little deeper into the configuration paramters we can use the official setup guide for Elasticsearch and Docker.
We can now start the container with the following command. For this to work your working directory must be the same as the one where the docker-compose.yaml file is stored in.
# Start elasticsearch and monitor the logs
docker compose up -d && docker logs -f elasticsearch-node-1

# Exit the logs by pressing CTRL+c
Let's do a quick connection test before we continue. Since the elasticsearch container is using a self-signed certificate we must specify the -k flag in our cURL command to allow untrusted certificates.
# Check wether our elasticsearch instance is up and running
curl https://localhost:9200 -k

# --- Response ---
{"error":{"root_cause":[{"type":"security_exception","reason":"missing authentication credentials for REST request [/]","header":{"WWW-Authenticate":["Basic realm=\"security\" charset=\"UTF-8\"","Bearer realm=\"security\"","ApiKey"]}}],"type":"security_exception","reason":"missing authentication credentials for REST request [/]","header":{"WWW-Authenticate":["Basic realm=\"security\" charset=\"UTF-8\"","Bearer realm=\"security\"","ApiKey"]}},"status":401}
Great! Our instance is now up and running and we can use it to store data. However, we're not done yet. Let's continue with Kibana.
Kibana
Here we again need to create a new directory where we can save the docker-compose.yaml file to.
# Create a new directory
mkdir kibana

# List content of current working directory
ls
> elasticsearch kibana

# Change directory
cd kibana
We copy the following content to a file named docker-compose.yaml.
version: "3"

volumes:
  config:
  data:

services:
  node:
    image: docker.elastic.co/kibana/kibana:8.11.2
    volumes:
      - config:/usr/share/kibana/config
      - data:/usr/share/kibana/data
    ports:
      - 127.0.0.1:5601:5601
    healthcheck:
      test:
        [
          "CMD-SHELL",
      "curl -s -I http://localhost:5601 | grep -q 'HTTP/1.1 302 Found'",
        ]
      interval: 10s
      timeout: 10s
      retries: 120
    networks:
      - tutorial

networks:
  tutorial:
    external: true
docker-compose.yaml
Of course there is an official documentation for configuring Kibana for everybody who is interested.
The image tags of the docker images MUST have the same version. Otherwise Elasticsearch and Kibana are not compatible!
Alright. We can now start the Kibana container with the following command. Make sure that you are in the same directory as the Kibana docker-compose.yaml file.
# Start elasticsearch and monitor the logs
docker compose up -d && docker logs -f kibana-node-1

# Exit the logs by pressing CTRL+c
In the logs we can see, that Kibana needs to be configured.
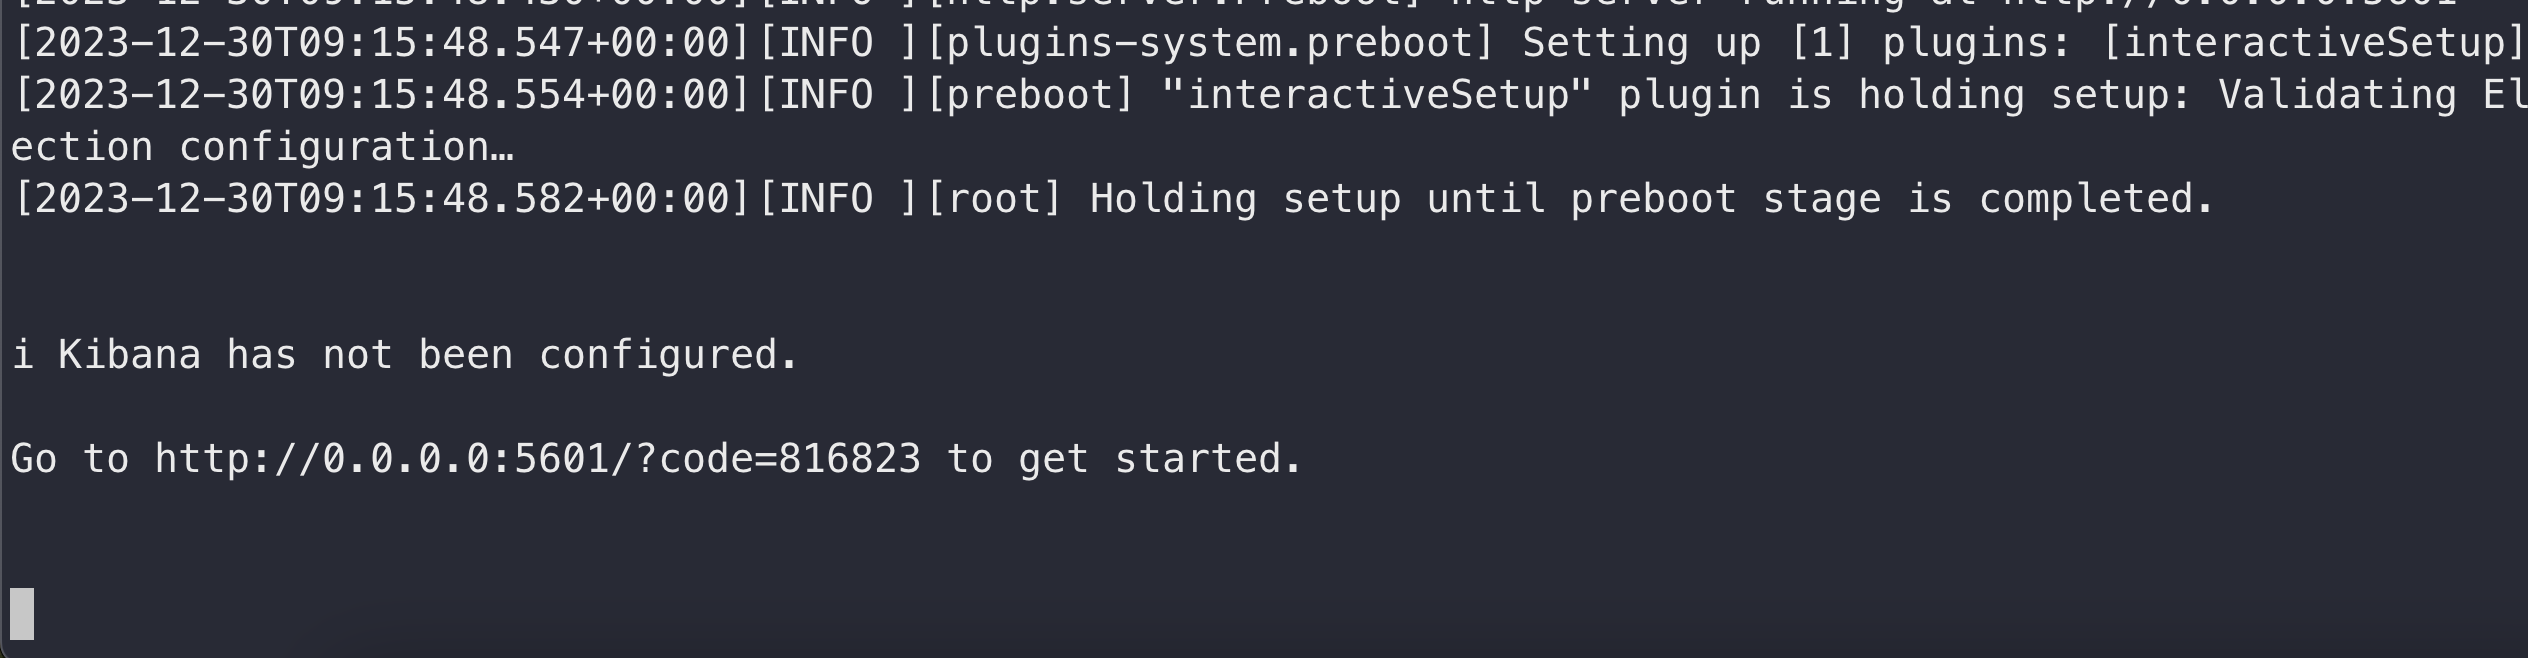
We need to define where it can find our Elasticsearch instance. Therefore, we will open up the browser and navigate to http://localhost:5601 where we are presented with the Kibana setup screen. Notice we're using http this time!

Kibana is now asking us to provide an enrollment token such that it can configure itself to work properly with Elasticsearch.
To get one we need to execute a script in the Elasticsearch container. We will use the following command to execute into the docker container.
# Execute into the elasticsearch-node-1 container
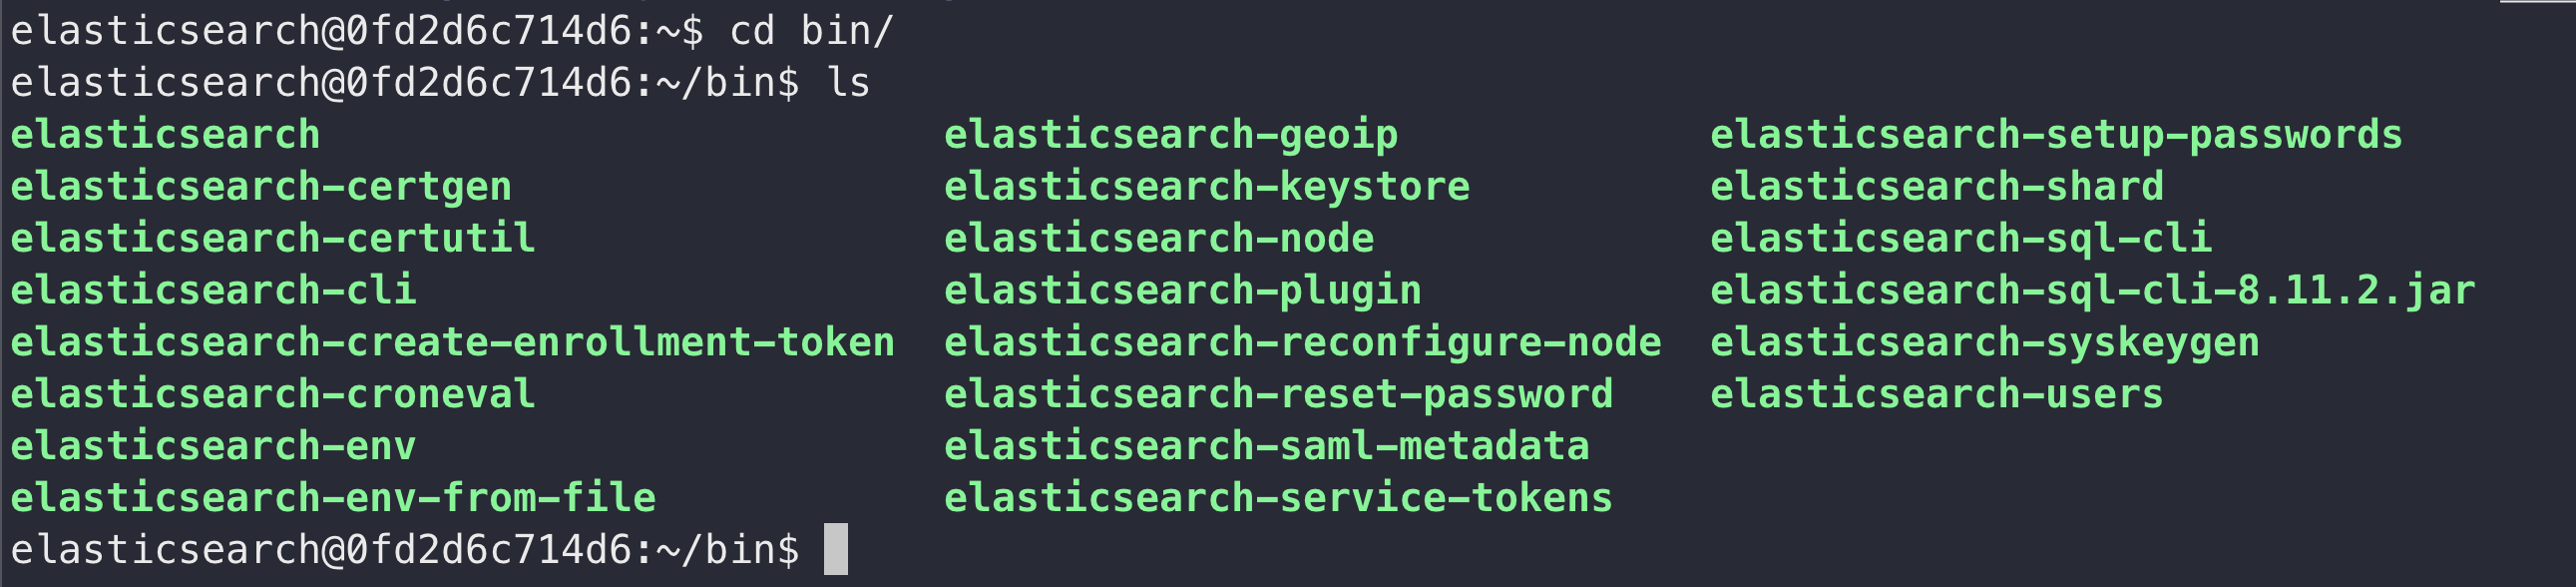
docker exec -it elasticsearch-node-1 /bin/bashWe should recognize that our terminal has changed and it should now look something like this.
elasticsearch@0fd2d6c714d6:~$ We're now in the Elasticsearch container and we can execute commands inside of it. Elastic provides multiple scripts to perform any kind of tasks. They're all located in ~/bin/. If we list the content of this directory we will see the following output.
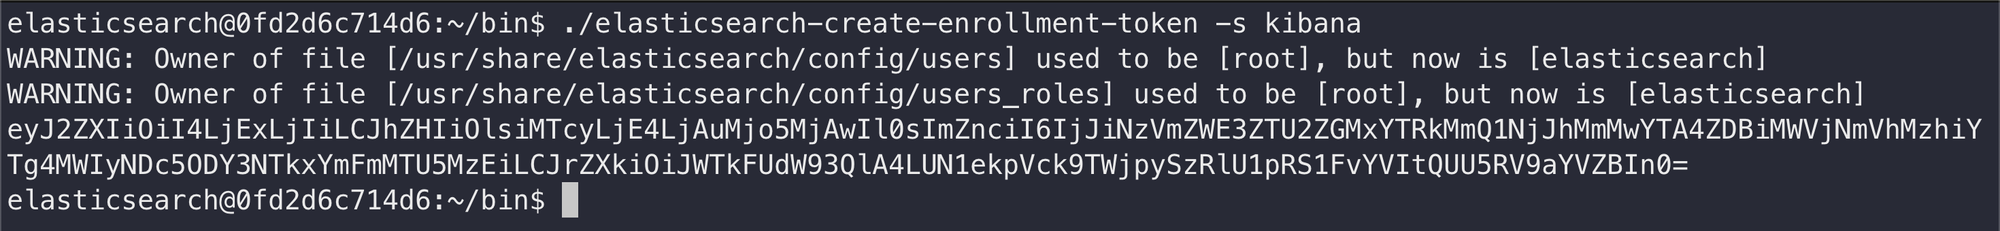
To create the enrollment token we need to execute the elasticsearch-create-enrollment-token script like this.
# Change directory
cd ~/bin/

# Create the enrollment token for kibana
./elasticsearch-create-enrollment-token -s kibana
When we executed the command we will be prompted with the token. Our output should look similar to the one below.
Now we copy the token, paste it in Kibana and press the Configure Elastic button.
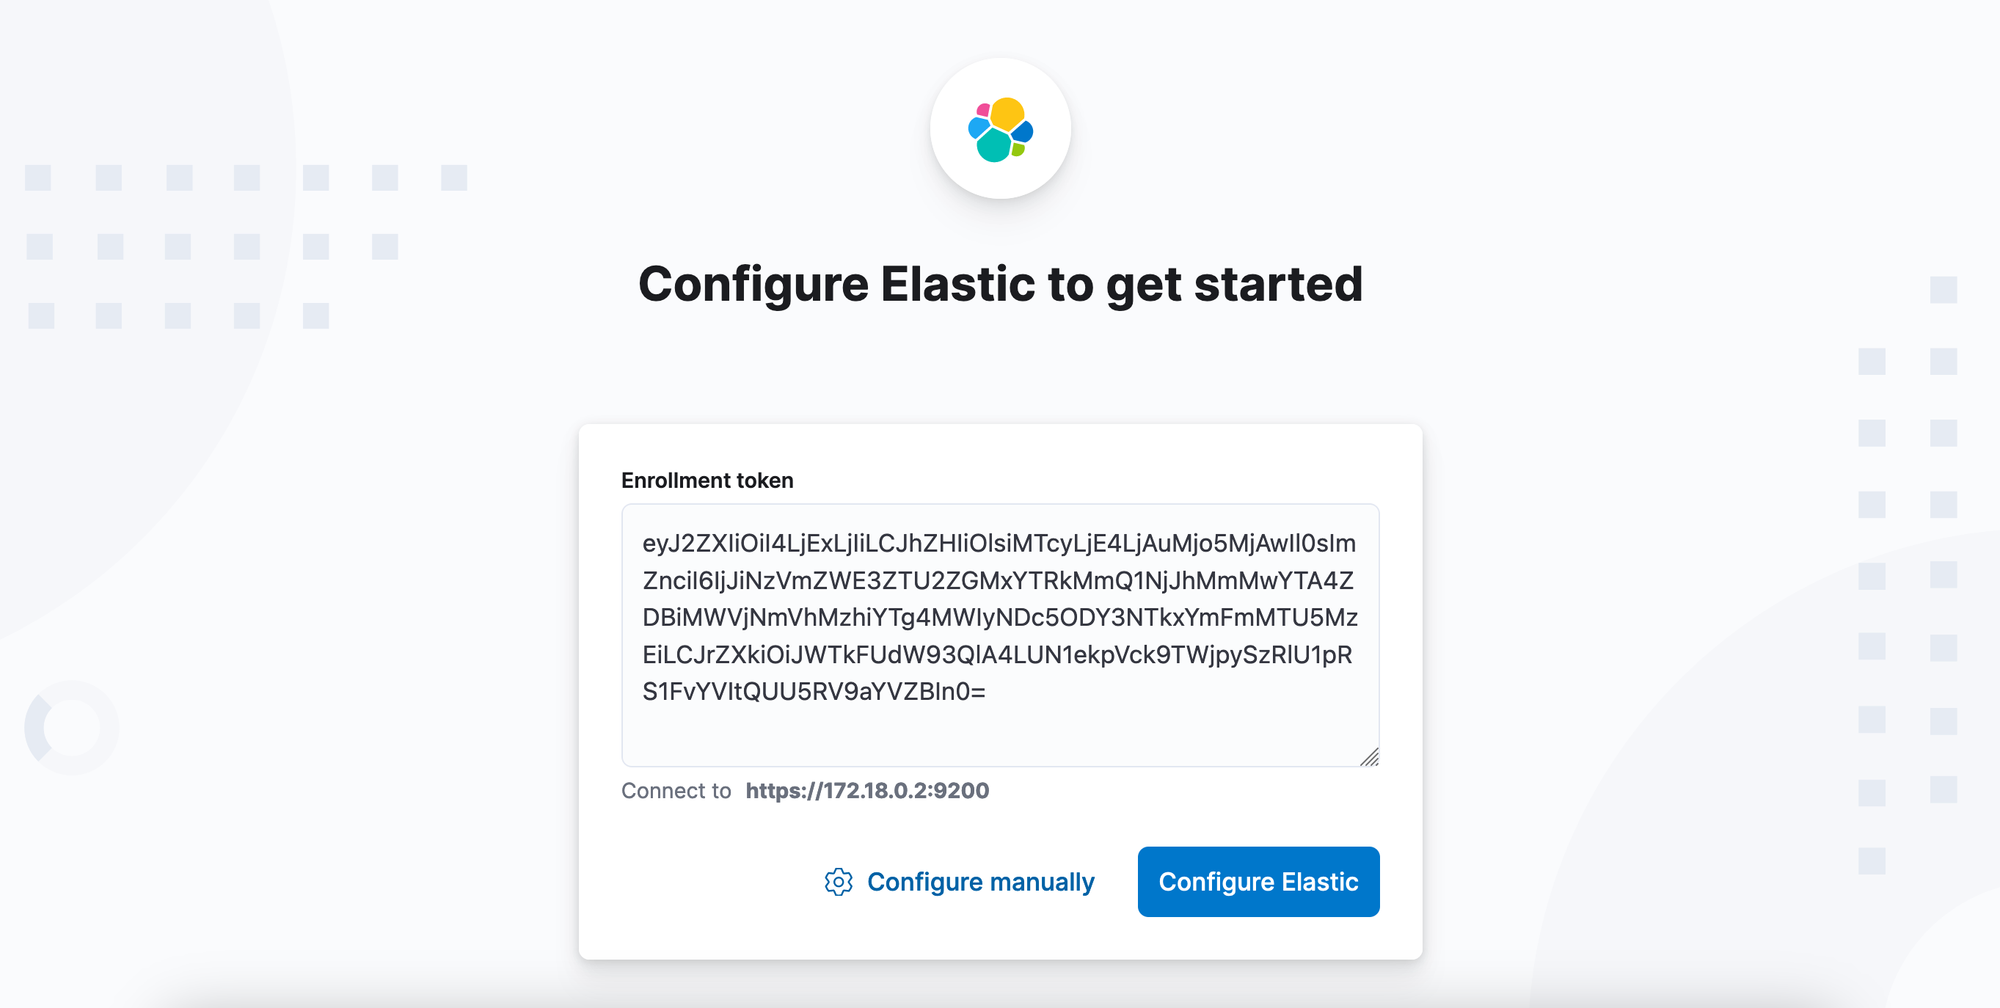
We will be prompted with a Verification required screen.
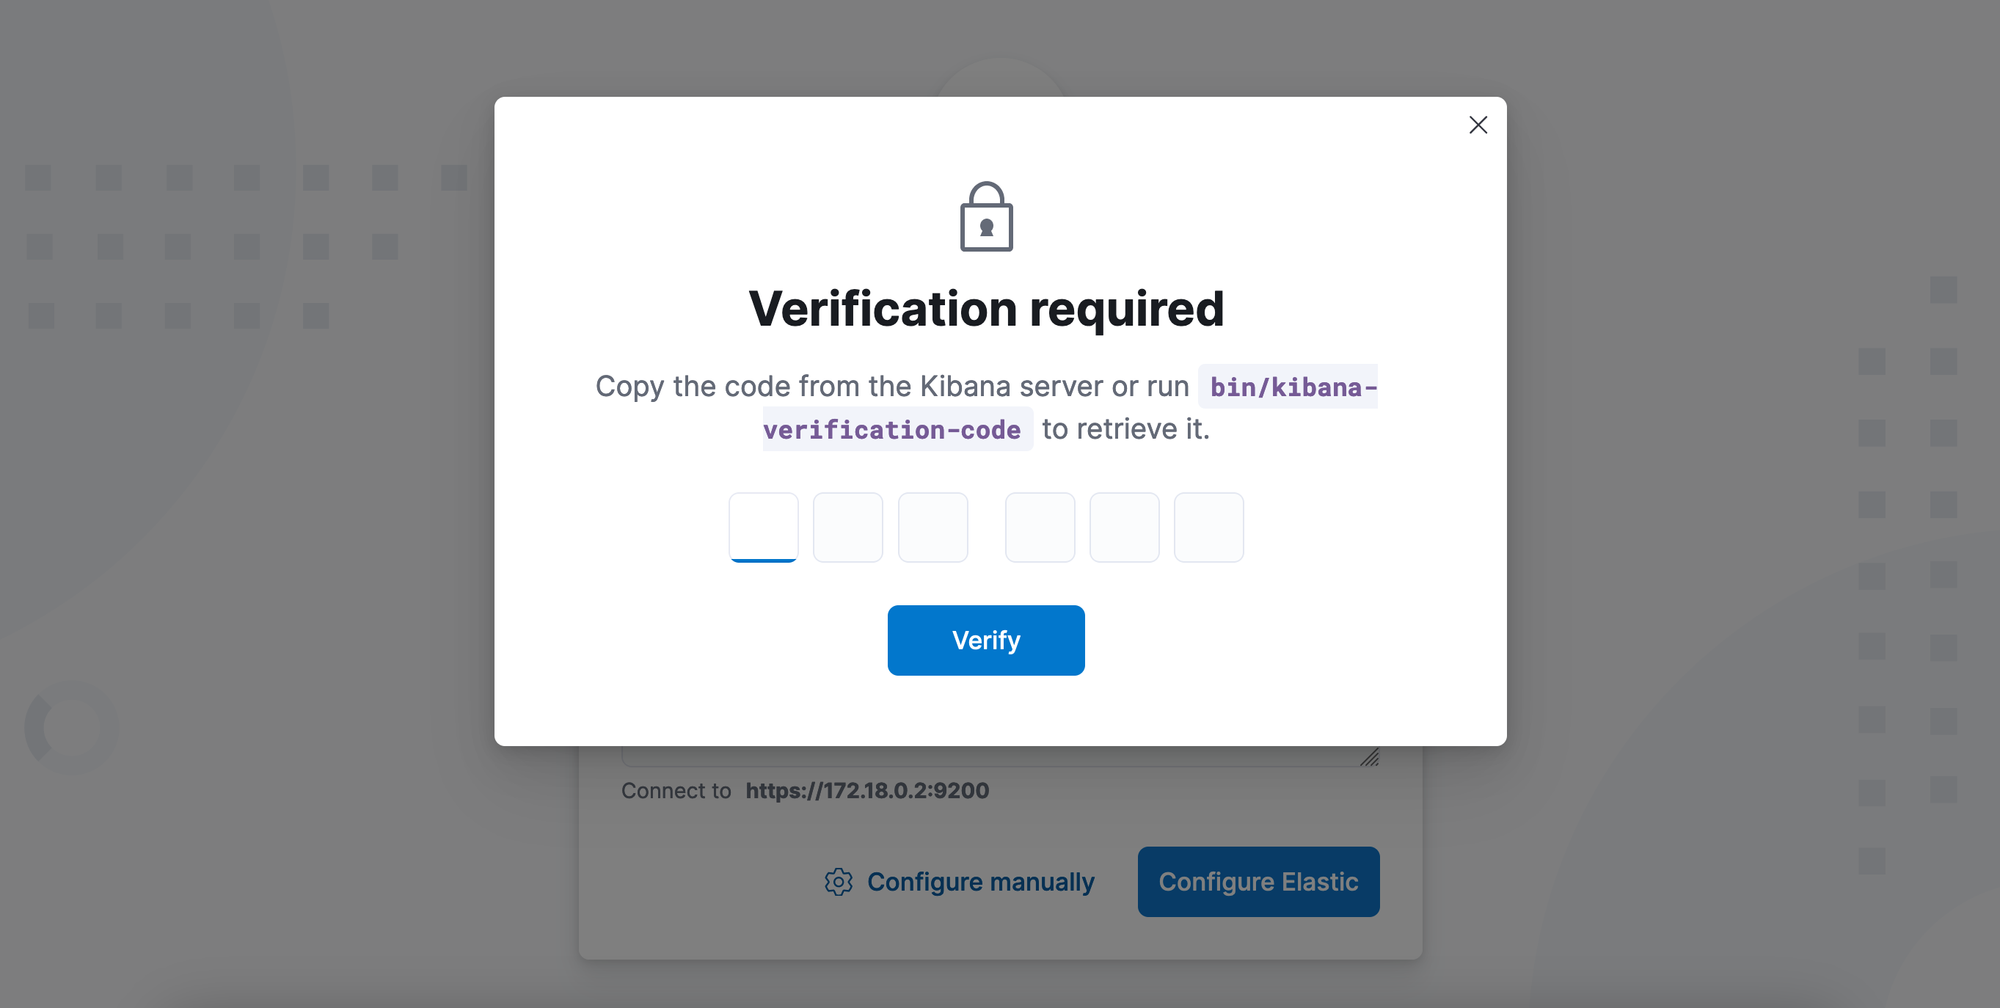
Here we need the 6-digit code Kibana printed in its logs. If we exited the logs we can view them again using the following command.
# View Kibana logs
docker logs -f kibana-node-1

# Exit the logs by pressing CTRL+c
If you restarted your Kibana instance during this time, your code might not be visible in the logs anymore. Then you can just follow the instructions on the screen and use the ~/bin/kibana-verification-code script inside of the Kibana container to generate a new one.
Now we type in our code and press Verify.

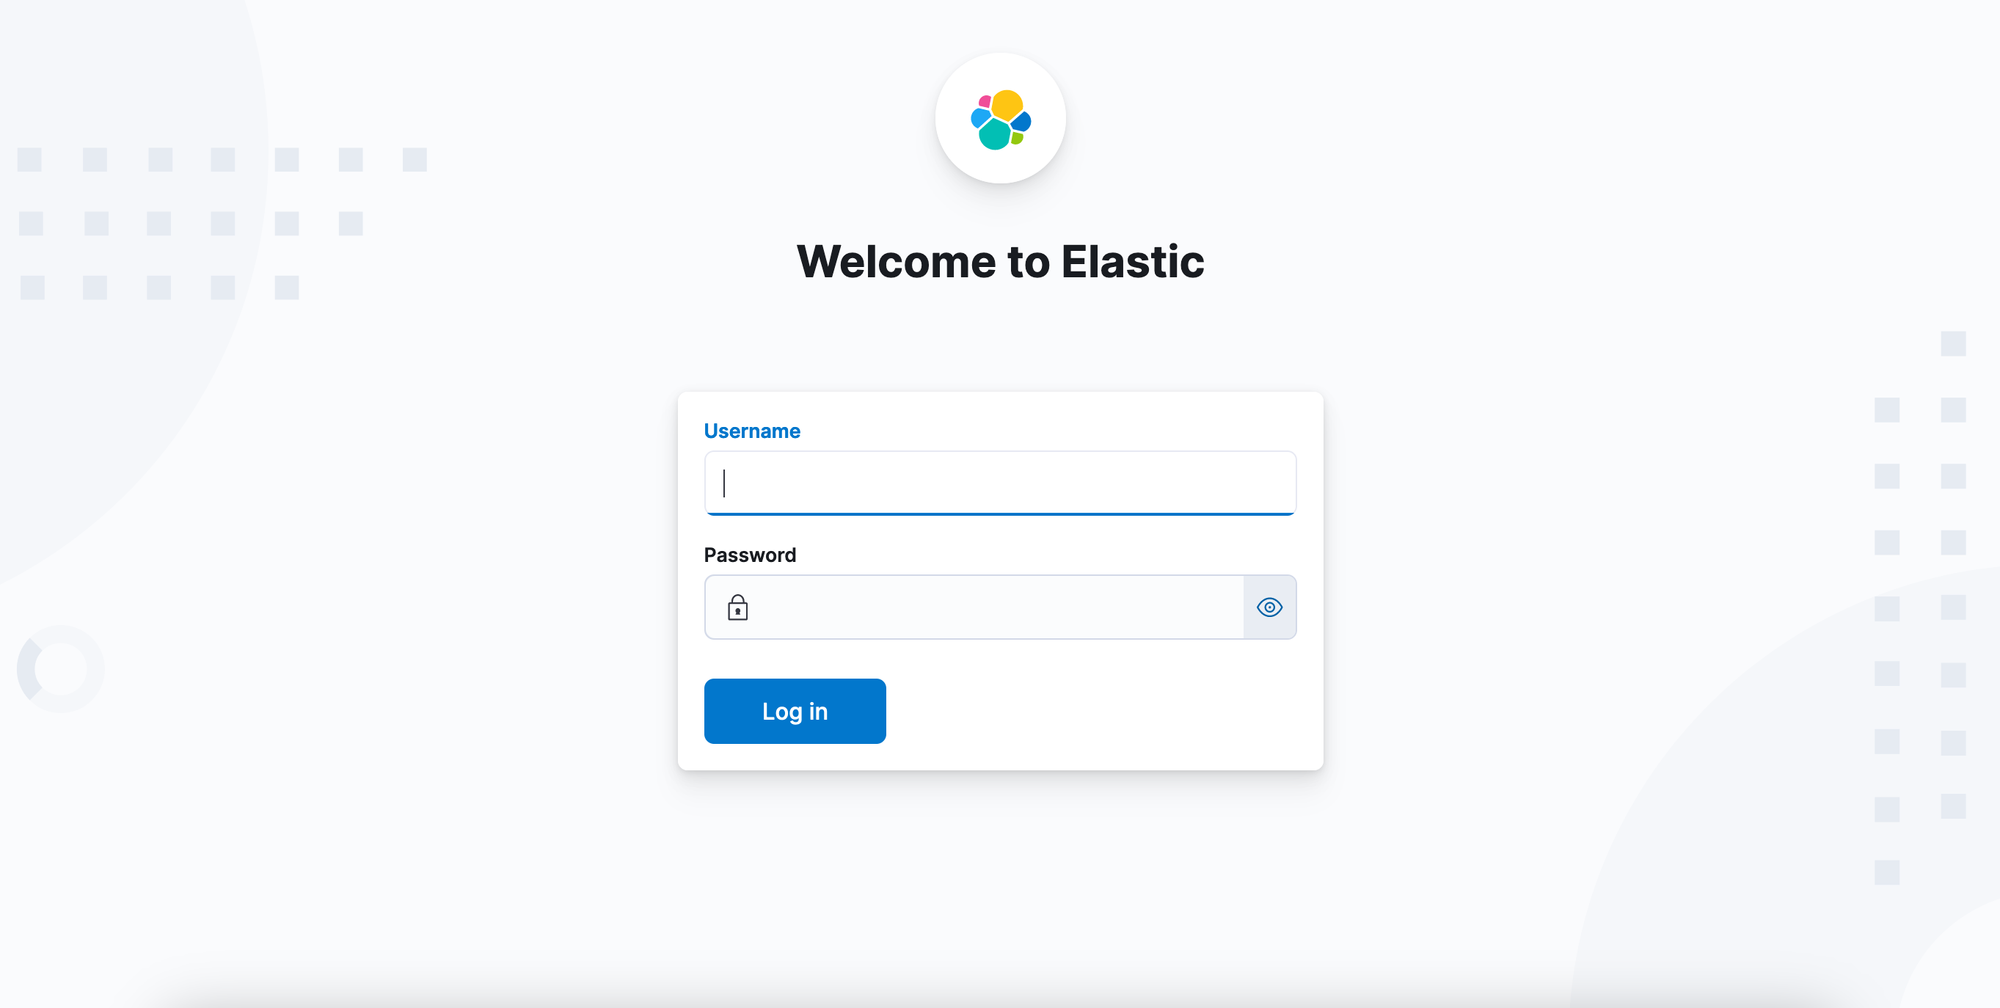
Now we will see the configuration process. When it's done we can see the Kibana login screen.
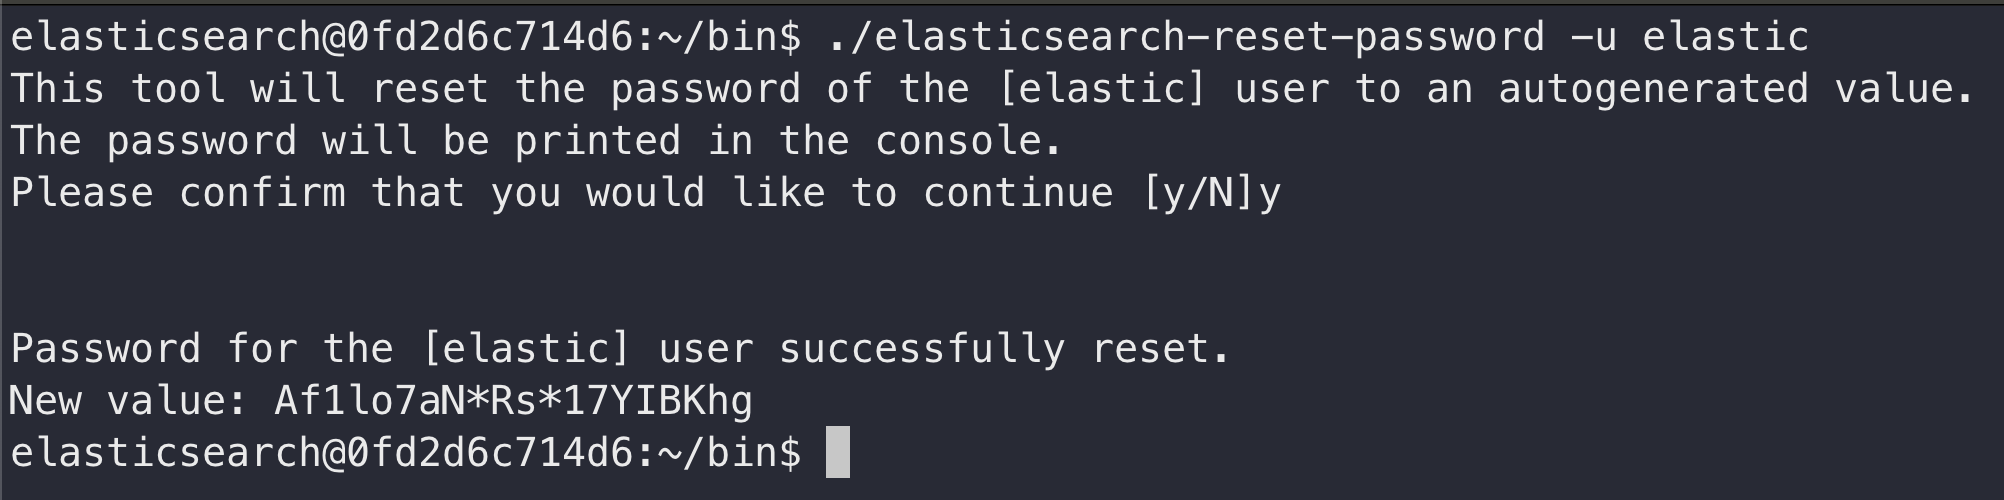
As the very last step we now need to set a password for the Elasticsearch default user elastic. We do this again with one of the provided scripts in the container. This time we use the elasticsearch-reset-password script with the -u flag specifying the username. You need to confirm that the generated password is printed to the terminal.
That's it. Congratulations! We can now login to Kibana using these credentials.
I hope you enjoyed reading today's post. If you want to know how you can continue from that point have a look at my article "Store and Visualize your Data with Elasticsearch and Kibana" where I show you how to save data to your Elasticsearch using Python and how you can visualize it in Kibana.
 Philipp Zimmermann
Up next in this tutorial series