Store and Visualize your Data with Elasticsearch and Kibana

This post requires an Elastic Stack consisting of one Elasticsearch database and one Kibana instance connected to it. If you just read my article on setting up your own Elastic Stack you're good to go. If not, you should totally read it. I will show you how to setup your own Elastic Stack on your local machine such that your data is completely private since it is under your control only.
 Philipp Zimmermann
In todays post however I want to show you how you can save data in your Elasticsearch database and how you can visualize it in Kibana.
Prerequisites
As said in the introduction we need an Elastic Stack for this tutorial. That means that we need access to an Elasticsearch database and the corresponding Kibana instance. If you do not have an Elastic Stack follow my tutorial to set one up.
About Elasticsearch
Before we get to the fun part of coding I want to explain how Elasticsearch handles data. Since Elasticsearch is a NoSQL database it stores its data as so called documents. These documents are JSON objects containing the data and they are stored in so called indices. You can think of indices and documents as books and pages. An index is the book while each book has multiple pages - documents. To query a document you need to know the index where it is stored in. You can also query one index for its documents.
OpenWeatherMap
Before we can visualize data in Kibana we first need to collect some. Therefore, we will write some Python code to query the OpenWeatherMap API and store the weather information in our database.
Therefore, we need to signup at OpenWeatherMap. After that we can login and generate a new API key here.
Implementing the Crawler
Now before we implement our crawler let us think about what we want. First we need a connector who is able to save data to our Elasticsearch database. We will call it ElasticsearchConnector. Second we need a connector who is able to query OpenWeatherMap to obtain some weather data. Let's follow the schema and name it OpenWeatherMapConnector. And last but not least we need our crawler which we will just name Crawler.
ElasticsearchConnector
#!/usr/bin/python3

import datetime
from elasticsearch import Elasticsearch


class ElasticsearchConnector:

    def __init__(self, es_url, es_user, es_pass):
        """
        Initialize ElasticsearchConnector.
        """
        self.es = Elasticsearch(es_url, basic_auth=(es_user, es_pass), verify_certs=False)

    def push(self, index, doc):
        """
        This function pushes data to the elasticsearch cluster.

        Parameters:
        - index: The index used to store the data in
        - doc: Data to be stored

        Returns:
        - Response from ElasticSearch
        """
        if not "timestamp" in doc.keys():
            doc["timestamp"] = datetime.datetime.now()
        resp = self.es.index(index=index, document=doc)
        return resp["result"]
elastic.py
OpenWeatherMapConnector
#!/usr/bin/python3

import json
import requests


class OpenWeatherMapConnector:

    def __init__(self, api_key):
        """
        Initialize OpenWeatherMapConnector.
        """
        self.api_key = api_key

    def collect_weather_data(self, location, lat, lon):
        """
        This function collects the weather data for the current timestamp.
        """
        # Query API for given location
        resp = requests.get(f"https://api.openweathermap.org/data/3.0/onecall?lat={lat}&lon={lon}&appid={self.api_key}&units=metric")
        raw_data = json.loads(resp.text)

        # Parse data
        doc = {
            "loc": {
                    "name": location,
                "lat": lat,
                "lon": lon
            },
            "temp": {
                "current": round(raw_data["current"]["temp"], 1),
            }
        }

        return doc
openweathermap.py
Crawler
#!/usr/bin/python3

import warnings
warnings.filterwarnings("ignore")

from elastic import ElasticsearchConnector
from openweathermap import OpenWeatherMapConnector

class Crawler:

    def __init__(self):
        """
        Initialize Crawler.
        """
        self.es_connector = ElasticsearchConnector(
            es_url="https://localhost:9200",
            es_user="elastic",
            es_pass="Af1lo7aN*Rs*17YIBKhg"
        )

        self.owm_connector = OpenWeatherMapConnector(
            api_key="8a2078666d2aada21f5a7c03959dea93"
        )

        self.locations = {
            "Berlin": (52.50471436645461, 13.408208157197182),
            "London": (51.49818636961379, -0.14624209926360407),
            "New York City": (40.697019287570264, -73.99621693668729),
            "Tokio": (35.716424879134756, 139.6424914493901)
        }

    def run(self):
        """
        This function crawls the weather data and saves it to the database.
        """
        # Iterate over all locations
        for location, coordinates in self.locations.items():

            # Get weather data
            lat, lon = coordinates
            doc = self.owm_connector.collect_weather_data(location=location, lat=lat, lon=lon)

            # Store weather data in database
            print(self.es_connector.push(index="weather", doc=doc))


if __name__ == "__main__":

    crawler = Crawler()
    crawler.run()
crawler.py
Still a good idea. I like the way you think ;)
The first to files elastic.py and openweathermap.py can just be copied from above. However, when we copy the crawler.py we must make sure to update the following variables in the crawlers' __init__() function.
es_urlwhich must be the URL of your Elasticsearch instance. Note that it must include the protocol (e.g. https) and the port (e.g. 9200)es_userwhich is the username for your Elasticsearch instancees_passwhich is the corresponding password for your Elasticsearch usernameapi_keywhich is your OpenWeatherMap API key
After we updated the file let's run the code.
# Make sure we have all files copied correctly
ls
> elastic.py openweathermap.py crawler.py

# Install the required packages
pip3 install elasticsearch

# Run the code
python3 crawler.py
If the output looks somethink like this we know everything worked out well.
created
created
created
created
Great. We now have stored our collected weather data in our Elasticsearch database. Let's take a look at it using Kibana
Data visualization with Kibana
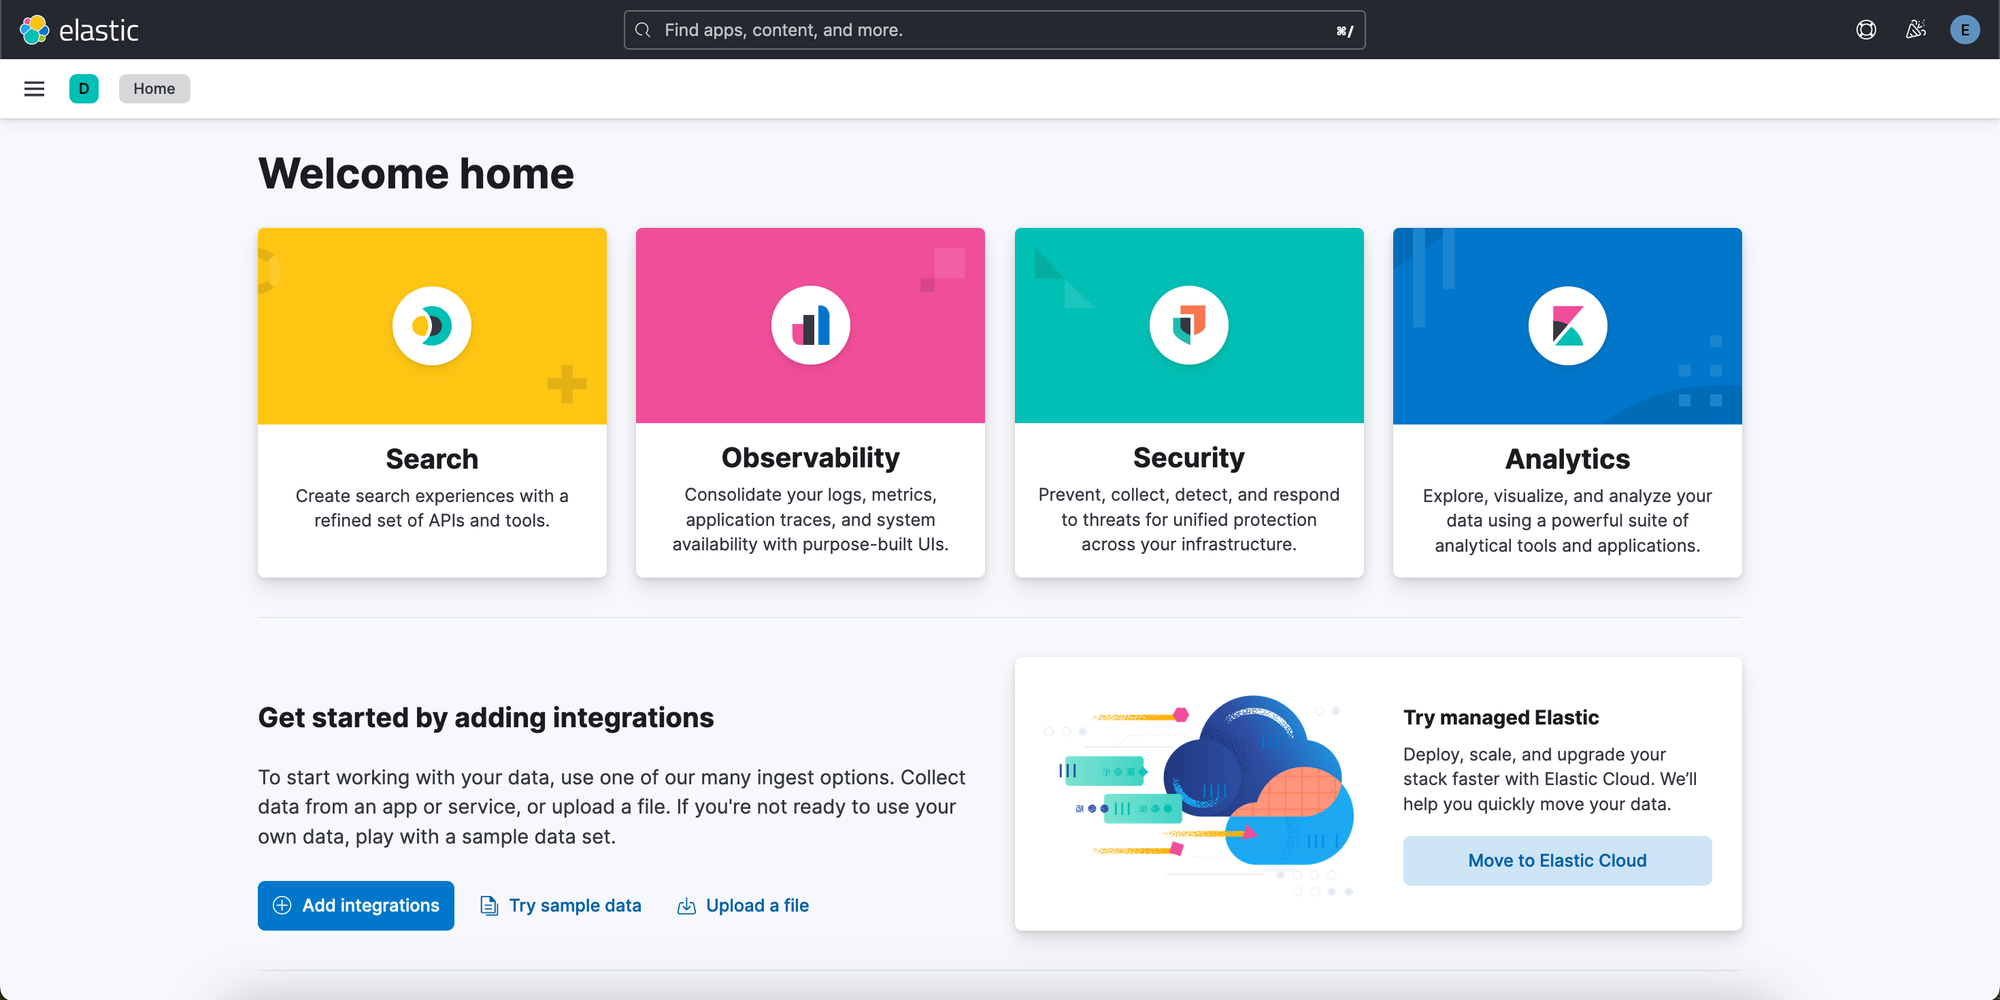
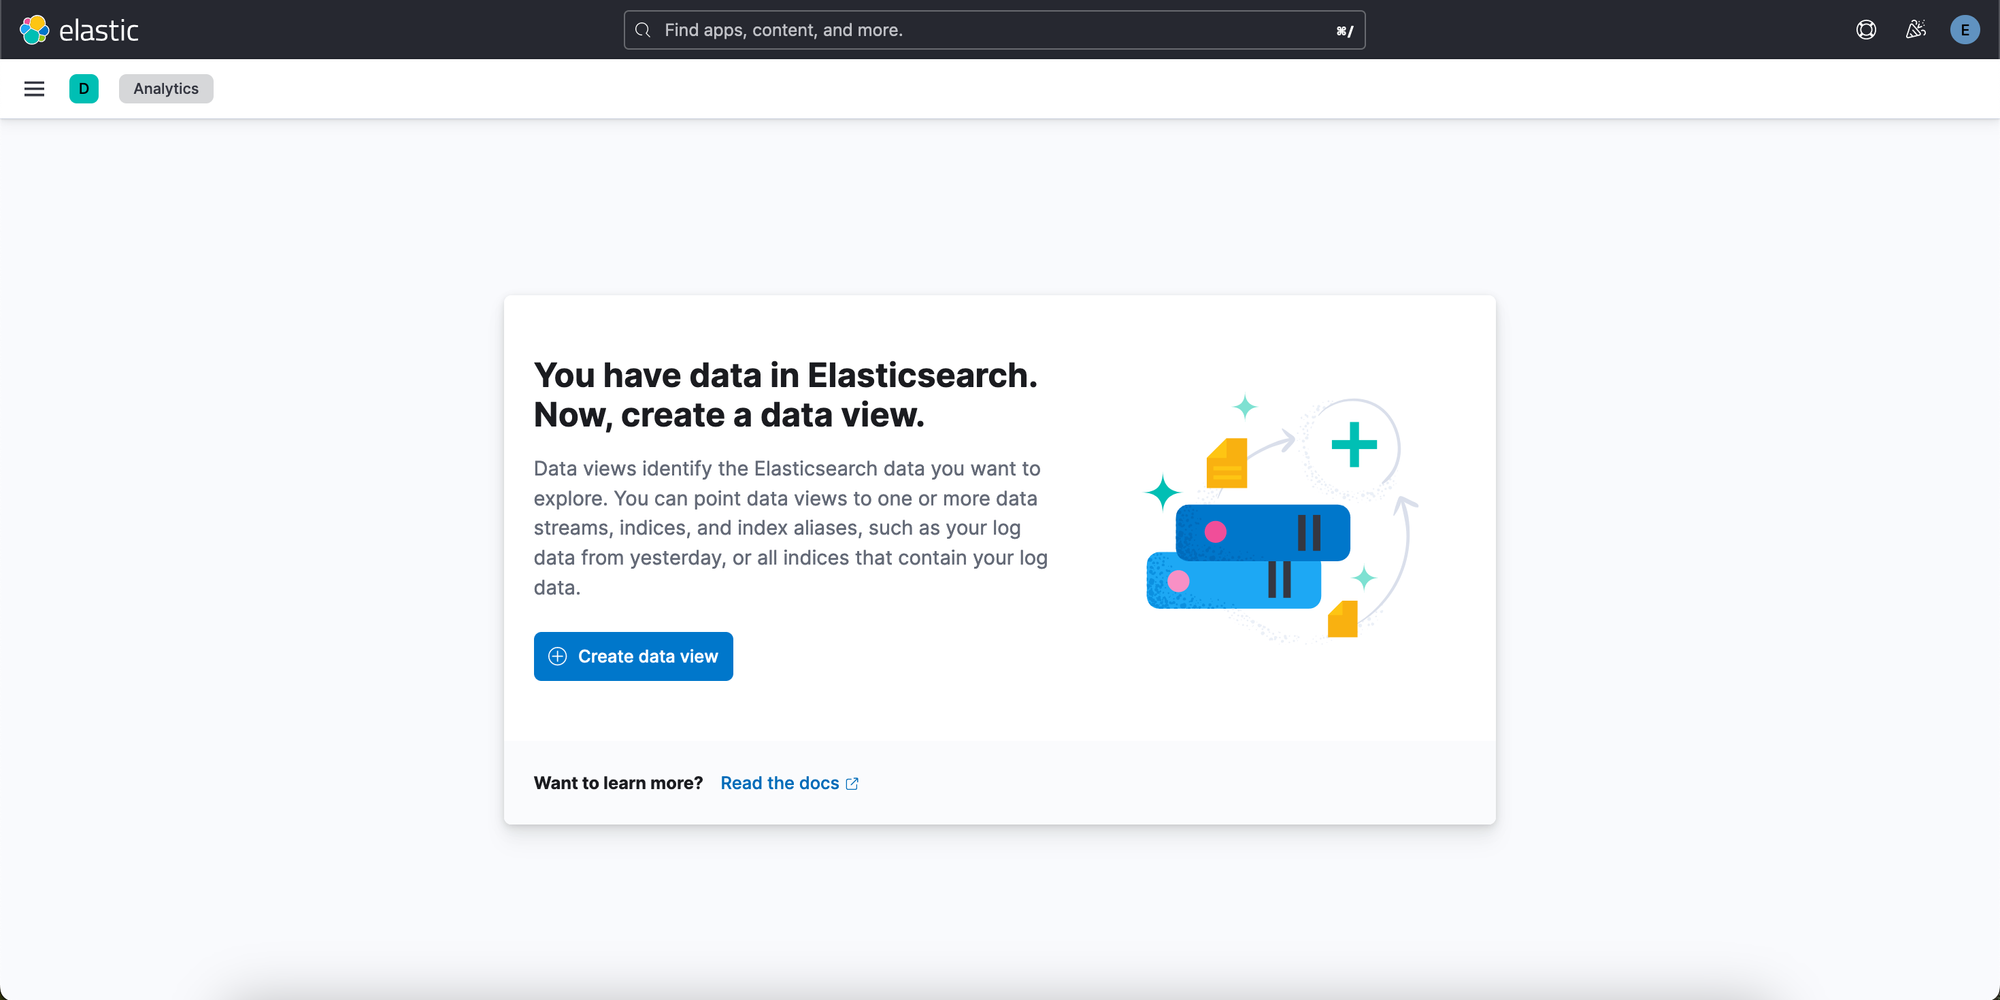
Since we created a new index for our crawler we named weather the first step we need to take is to create a new data view to see our data. Therefore, we must navigate to Analytics and click on Create data view.
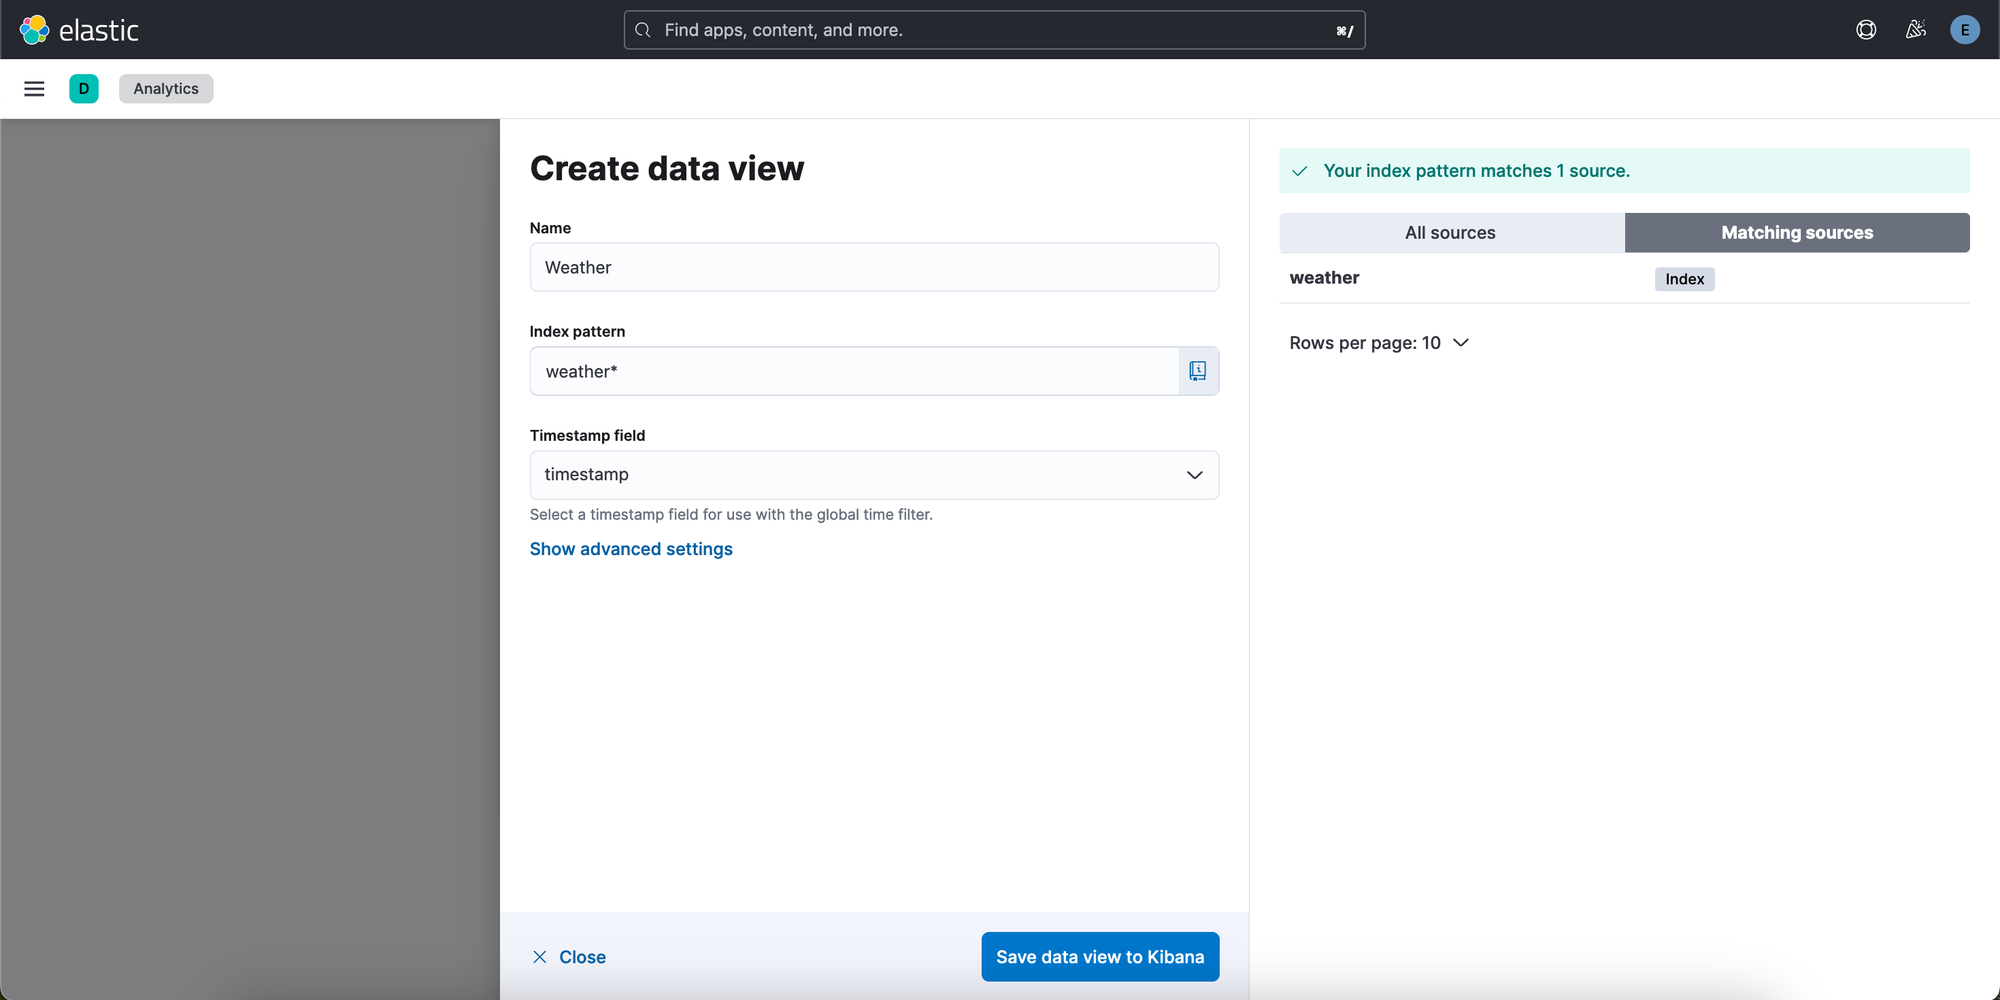
On the right we see a list of all our indices and on the left we can put in all information we need to provide. Then we click on Save data view to Kibana.

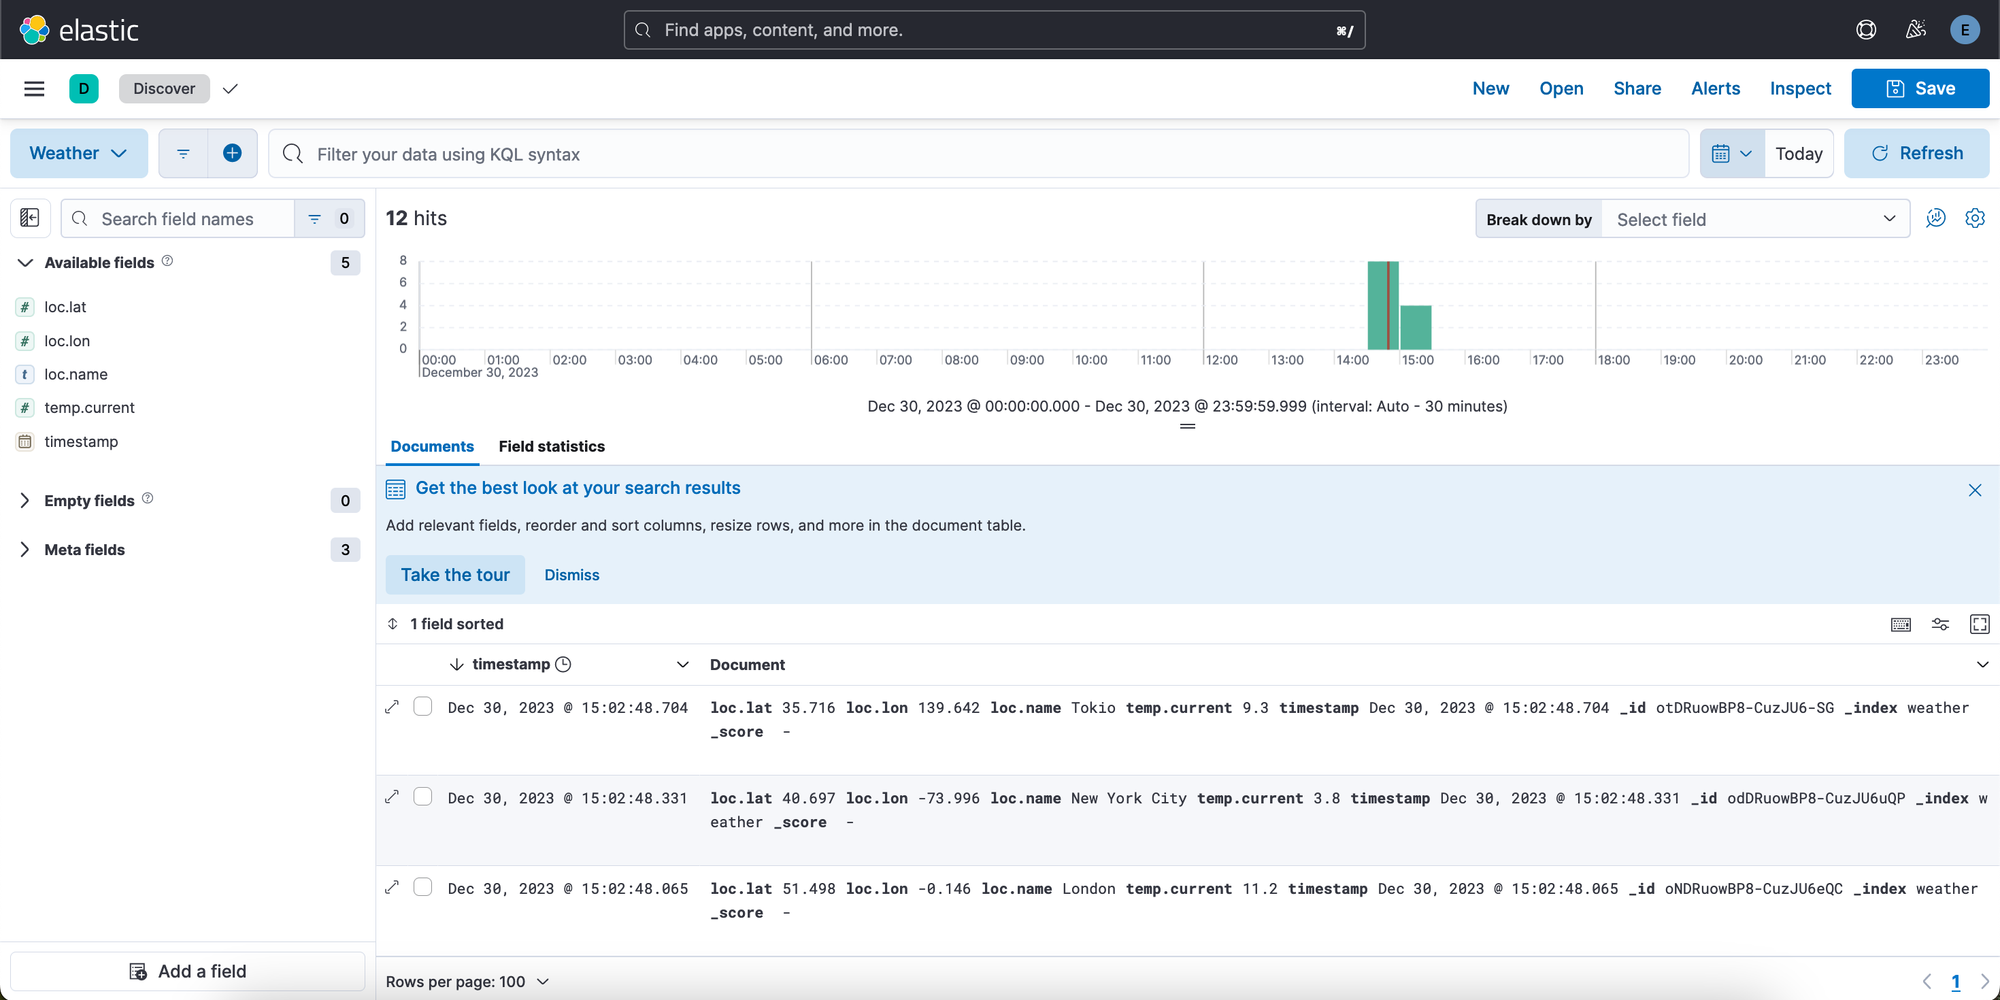
Now we navigate to Discovery and after we set the time range to Today we will see our crawled data like below.
That's it. Congratulations! From now on, I would suggest playing around with Kibana a bit. It's fun and you learn a lot. I recommend getting your hands dirty with dashboards. It's a way to visualize your data with great looking charts, tables and more.